#46 Locating a snowboarder 🏂 on a slope
#46 Locating a snowboarder 🏂 on a slope
Locating the Yeti ❄️
Michał and me are great fans of snowbaording. In 2010 we dreamed of an application for snowboarders. The app’s intention was to give greater fun to skiers and snowboarders through gamification and to ensure their safety in case of emergency. We called the project YETI - Your Emergency Tracking Interface.
We created the first prototype of the app that would track snowboarder’s location and we wanted to test it in the field. It turned out, that in the mountains we have to face unusual challenges, which you don’t think of when designing an app. The app would:
- call an emergency number in case of an accident (if there was a satisfactory cellular network connection)
- gather and upload snowboarder’s stats to the web app (if there was Wi-Fi on slopes)
- be used by skiers or snowboarders on a slope (if their hands didn’t freeze)
- provide on-slope workout tracking statistics (if a battery lasted for a whole day in that cold and harsh mountain conditions)
High power consumption of location services, freezing weather and poor network connectivity seemed to be a bummer. In 2014 we presented the project during the Val d’Isere (ski resort) hackathon. We decided to focus on the safety features of the application. In our opinion going down a slope with a snowboard under your feet is all you need to fully enjoy your time in the mountains. Unfortunately, judges didn’t share our point of view. We decided we didn’t want to invest more time in that idea. It seemed like it was the end of the project. Or was it?
Snowboarding on the slopes of La Rosiere 🏔
Some time later, on the other side of the world where no one has ever seen snow, our friend Dominik attended a conference where he saw a presentation about barometers being used in mobile devices to determine the transportation context (idle/walking/in a vehicle). This approach was very appealing because compared to other sensors a barometer is very energy efficient. That inspired him to seek other potential use cases for a barometer sensor. Because he loves snowboarding as well, it did not take him too much time to realise that it could be used in the mountains to detect skiers position or at least a lift that they take to get to the top of a mountain.
A barometer is a sensor which allows you to track changes in the atmospheric pressure. Thanks to Apple, iPhone 6s comes with a built-in barometer. Have you ever wondered why it is there? You could use it to improve your awesome weather forecast app or you could take it to the mountains on your next snowboarding trip! Because weather forecasting is not really our thing, we decided to explore the latter option. Equipped with iPhone 6s, our sampling app and snowboards, we went to La Rosiere, a ski resort located in the Northern French Alps, near to the border with Italy to test our new idea - location detection based on relative changes in altitude.
Sampling atmospheric pressure on iOS 📱
To get altitude data on iOS you use CMAltimeter object from the CoreMotion framework. First, you should check if your device is able to deliver such data:
CMAltimeter.isRelativeAltitudeAvailable()
If yes, you can initialise a CMAltimeter object and start receiving altitude updates on a background queue:
let queue = OperationQueue()
queue.qualityOfService = .background
queue.maxConcurrentOperationCount = OperationQueue.defaultMaxConcurrentOperationCount

let altimeter = CMAltimeter()
altimeter.startRelativeAltitudeUpdates(to: queue,
	withHandler: { data, error in //(CMAltitudeData?, Error?)
		guard error == nil else { return }
		guard let data = data else { return }
		//NOTE: process data 🏂!!!
})
The system starts sampling atmospheric pressure and calls the handler with CMAltitudeData when new data is available. The data contains relative change in altitude since the beginning of measurements and the pressure in kilopascals.
The first altitude event delivered to the handler contains relative altitude equal to 0 meters and a measured atmospheric pressure value. Subsequent events contain a number that corresponds to the relative altitude change with respect to the first event, i.e. if altitude changed from 450 to 455 meters the system would report relative altitude equal to 5 meters.
When you do not wish to receive altitude updates anymore you should call this method:
altimeter.stopRelativeAltitudeUpdates()
Sampling La Rosiere 📱
We created a simple app that allowed us to capture the atmospheric pressure with a location and a manually provided location name. We were able to select a pre-defined name for a location, i.e. from ski-lift names either at the bottom or at the top of a slope. That was useful in the next phase of the project.
The application worked in background so we could easily lock the screen and still be getting location and altitude updates. At the end it turned out that using an accessibility feature called Guided Access makes it easier to select a location name than unlocking the phone at every bottom and every top of the slope, so we ended up with the app launched all the time in the guided mode.
Our application collected samples that contained the following data:
struct Sample {
    let timestamp: Date //from device clock
    let pressure: Double //from CMAltimeter
    let relativeAltitude: Double //from CMAltimeter
    let altitude: Double //from CLLocationManager
    let latitude: Double //from CLLocationManager
    let longitude: Double //from CLLocationManager
    let horizontalAccuracy: Double //from CLLocationManager
    let verticalAccuracy: Double //from CLLocationManager
    let name: String //manually provided
    }
The samples were stored using Core Data and exported to a JSON file for further processing. Current version of the Sampling app uses Encodable protocol and Swift 4. The code is available here.
Lift ride detection
After the trip we got down to analysing the collected data. We wanted to create an algorithm to detect the transportation context of the snowboarder (on the lift/riding down the slope). A simple simulator was created to replay all the readings in the exact same order so that they can be seen as if they were coming from the barometer itself.
Ideally, we would like to be able to process data coming from that simulator as a stream i.e. by receiving new relative altitude reading one at a time. The algorithm should be able to detect whether a snowboarder is on a lift or not each time a new reading arrives. As we try to be as energy efficient as possible, this processing should be relatively simple.
First idea we tried uses simple thresholds. Each time a new barometer reading arrives, the algorithm calculates the average change of altitude over a sliding window of a fixed size (e.g. last 20 readings). If that average is greater than the up threshold, the lift start event is emitted. From now on we assume that a person is on a lift all the time until the lift end event is emitted.
Simple, right? However, lifts often stop for a short while which is depicted as a flat line on the plot. This happens because sometimes people fall out of lifts or lose their gloves so the lift operator has to stop or slow down the lift for a short while. Just by looking at the plot, we do not know whether the flat line means that a lift ride has finished or simply stopped for a moment. The lift end event is emitted when the algorithm detects the decrease of the altitude greater than the down threshold. With that approach we sometimes get a lot of plateaus on the plot wrongly classified as a lift ride. In real life the snowboarder can go for a meal in a chalet at the top of the lift or can just be standing on the top to decide where to go which would delay the altitude decrease. The plateaus can be easily filtered out by additional methods.
Our lift detection method is illustrated in the following plot. Blue color indicates lift rides detected by our algorithm. Icons at the bottom indicate whether Maciej was taking the lift or snowboarding. You can adjust the parameters to see how they impact the detection. Notice that if the sliding window size is too small or if the down threshold is too big, we may detect a pause on the lift as the lift end (see second and third lift from the left).
Lift classification
In the previous step we managed to detect start and end of the lift ride. In order to determine the location of the skier or snowboarder expressed in terms of the lift which they use at that moment, whenever the lift start event is triggered the relative altitude readings are stored until the lift end event is raised. We refer to the readings between the lift start and lift end event as the lift signal.
Imagine we have a newly collected lift signal. How could we guess which of the lifts in La Rosiere it corresponds to? We could try to do it by using the k-Nearest Neighbours classifier which guesses a lift name by finding the most similar lift signals among those earlier annotated and added to our database of lifts. What does the most similar mean? That needs to be defined. Let’s start by defining a simple three dimensional space. Let’s divide the lift signal into three chunks of the same size. First chunk corresponds to the altitude changes during first 33% of the lift ride. Second chunk to the next 33% and the last one to the last 33%. For each chunk let’s compute total change in the altitude and plot it on each axis. In such defined space we could use Euclidean distance to find the most similar lifts to the one we want to classify.
The plot above represents lift signals for all ski lifts sampled during the trip to La Rosiere. You can hover over the point to reveal the name of the ski lift and rotate the plot by a drag to see it from different angles. You can notice that lift signals coming from the same lifts form compact groups. When we want to guess the name of a new lift signal we put it in the plot and find the group which is the closest to the signal.
We have not collected enough data to evaluate the accuracy of the model. Moreover, there are 38 lifts in La Rosiere ski station and we have samples from only 11 of them. Therefore, it is hard to predict how difficult it would be to classify all of them. We believe that it is possible. If that simple approach not yielded satisfactory results, more complex features could be extracted from the lift signal to define the space in which it would be easier to uniquely identify lifts.
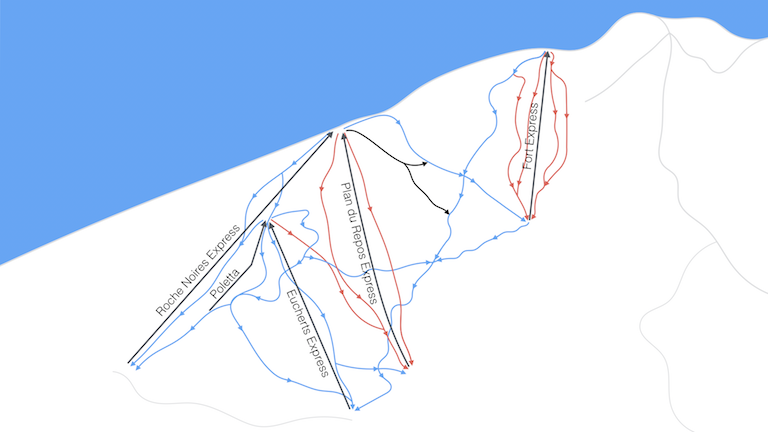
On top of that, classification accuracy could be improved by using previously detected lift and the ski resort topology. Slopes and ski lifts in the ski resort form a directed graph. For example if we took the Fort Express lift we cannot take lifts Poletta or Roche Noires Express right after because it is impossible to get there by any direct path.
Summary
In this post we showed you a proof of concept for ski lift ride detection in the mountains. The idea was inspired by the paper coming from National University of Singapore (Using Mobile Phone Barometer for Low-Power Transportation Context Detection).
A barometer is a low-power consuming sensor that can be used for context detection (taking a lift/snowboarding) by measuring relative altitude changes. In the mountains it can be used as a trigger to use more precise sensors such as GPS to track the exact location whenever a person exits a lift. BTW, the reason why barometers were introduced in mobile devices is fixing the height error in obtained GPS position. Using a barometer in snowboarding tracking apps could somewhat solve a battery drain problem.
During 4 days of snowboarding we collected over 14 hours of data, both the atmospheric pressure and a location based on satellite navigation systems. We gathered 32 lift signals from 11 different lifts.
We created the algorithm that is able to detect a lift ride. We want to implement the algorithm in Swift to be used in real-time in an iOS application to perform live detection. Furthermore, we would like to explore the lift classification topic but for that we need more data and support from a ski resort.
PS. ⌚️ Apple Watch Series 3 has a built-in altimeter! Yaaay! 🏂
Links
- Alti-sampler app
- Lift detector
- Dominik’s scatterplot.online - the most hipster plots on the web
- Using Mobile Phone Barometer for Low-Power Transportation Context Detection
- Apple documentation - CMAltimeter
- Apple Location and Maps Programming Guide
- WWDC 2017 - What’s New in Location Technologies
- La Rosiere
- La Rosiere - ski resort map