#6 Basic LLDB tips
Long story short
For a few years of programming iOS apps, my use of LLDB debugger has been minimal:
(lldb) po data.pressure
98.65814208984375

(lldb) po samples.count
28

(lldb) po (x + y)*z
96
That was all of it. Nothing to be proud of. Hitting a breakpoint and using a po command. I have known that po stands for ‘print object’ and that it can evaluate expressions. The more complex problems I had to deal with became, the more advanced toolbelt I needed.
Let’s start!
Discovering LLDB workshop
What you can always do is to type a help command:
(lldb) help
Debugger commands:

  apropos           -- Find a list of debugger commands related to a particular
                       word/subject.

...
You will already notice that even an apropos command is interesting. Let’s use LLDB’s ‘intelligence’ to suggest us commands for breakpoints:
(lldb) apropos breakpoints
The following built-in commands may relate to 'breakpoints':
  breakpoint                -- A set of commands for operating on breakpoints.
                               Also see _regexp-break.
  breakpoint clear          -- Clears a breakpoint or set of breakpoints in the
                               executable.
  breakpoint command add    -- Add a set of commands to a breakpoint, to be
                               executed whenever the breakpoint is hit.  If no
                               breakpoint is specified, adds the commands to
                               the last created breakpoint.


...
Not bad LLDB, not bad.
Do I have to use Xcode to work with LLDB?
Absolutely… not :) We don’t have to rely on Xcode’s Debug Area. We can easily launch LLDB from terminal. Before we do that we need to build an app for a simulator environment. From your project directory type:
michal$ xcodebuild -sdk iphonesimulator9.2
You will now have your *.app file ready for debugging at: project_dir/build/Release-iphonesimulator/appname.app.
Now, without changing the directory you can launch LLDB in Terminal:
michal$ xcrun lldb
(lldb)
Then you need to create a test target like that:
(lldb) target create ./build/Release-iphonesimulator/appname.app
Current executable set to './build/Release-iphonesimulator/appname.app' (x86_64).
Finally, you launch a process to start our session:
(lldb) process launch
Now you are at the same point when we run debugging in Xcode.
If you try to quit it with a standard Ctrl+C command, that won’t work. Use a quit command instead:
(lldb) quit
michal$
Why should I use a command line LLDB?
If you have looked through the results of(lldb) apropos breakpoint, you must have noticed plenty of possibilities. For more targeted help regarding breakpoints type:
(lldb) help breakpoint
Although Xcode has a subset of debugging features implemented in UI:
- Breakpoint Navigator (⌘ + 7)
- Debug Navigator (⌘ + 6)
- Debug Area (⌘ + Shift + Y)
- Debug menu item
when using LLDB from a command line we will get more detailed information.
Take a list of breakpoints, for example. In Debug Navigator you will see a method name, a line of code and information whether the breakpoint is active or not:
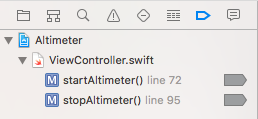
Athough this looks nice, LLDB command breakpoint list gives you more information like a hit count or an address:
(lldb) breakpoint list
Current breakpoints:
1: file = '/Users/michal/Developer/Swift/Altimeter/Altimeter/ViewController.swift', line = 72, locations = 1, resolved = 1, hit count = 1

  1.1: where = Altimeter`Altimeter.ViewController.startAltimeter (Altimeter.ViewController)() -> () + 712 at ViewController.swift:72, address = 0x00000001000e86b4, resolved, hit count = 1

  ...
We can get even more verbose output if we add params like -v. For a full list of params type:
(lldb) help breakpoint list
If you fancy practising more, try to play with breakpoint enable and breakpoint disable subcommands:
(lldb) breakpoint disable //disables all
(lldb) breakpoint disable 1.1 //disables just one place
(lldb) breakpoint enable //enables all
...
Setting simple and complex breakpoints
When using Xcode we are used to set breakpoints in a particular file at a given line. The command line LLDB offers not only this kind of breakpoints but much more. Let’s take a look at some examples, each showing a full and a short version of the same functionality:
- Breakpoint in file at a given line:
(lldb) breakpoint set --file ViewController.swift --line 26
(lldb) breakpoint set -f ViewController.swift -l 26
- Breakpoint(s) set at each selector method:
(lldb) breakpoint set --selector viewDidLoad
(lldb) breakpoint set -S viewDidLoad
- Breakpoint(s) set at each function name:
(lldb) breakpoint set --name stringToDate
(lldb) breakpoint set -n stringToDate
- Breakpoint(s) set at method names matching regexp:
(lldb) breakpoint set --source-pattern-regexp 'Manager' -file ViewController.swift
(lldb) breakpoint set -p 'Manager' -f ViewController.swift
- Breakpoint that is deleted after the first stop:
(lldb) breakpoint set <other_params> --one-shot
(lldb) breakpoint set <other_params> -o
Clearly this is just a small subset of commands available. For more information about setting breakpoint type:
(lldb) help breakpoint set
Navigating in debug session
You are well accustomed to using ‘continue’, ‘step in’, ‘step out’ and ‘step over’ buttons while debugging in Xcode. How would that look like as LLDB commands?
(lldb) thread continue
(lldb) thread step-in
(lldb) thread step-out
(lldb) thread step-over
As always, you can find more params by looking into thread’s help.
Other selected LLDB tricks
What else can we achieve with the command line LLDB? Well, let’s see.
Type formatting
You are probably familiar with ‘View Value As’ in Debug Area. It is used to quickly change displaying format of a given value:
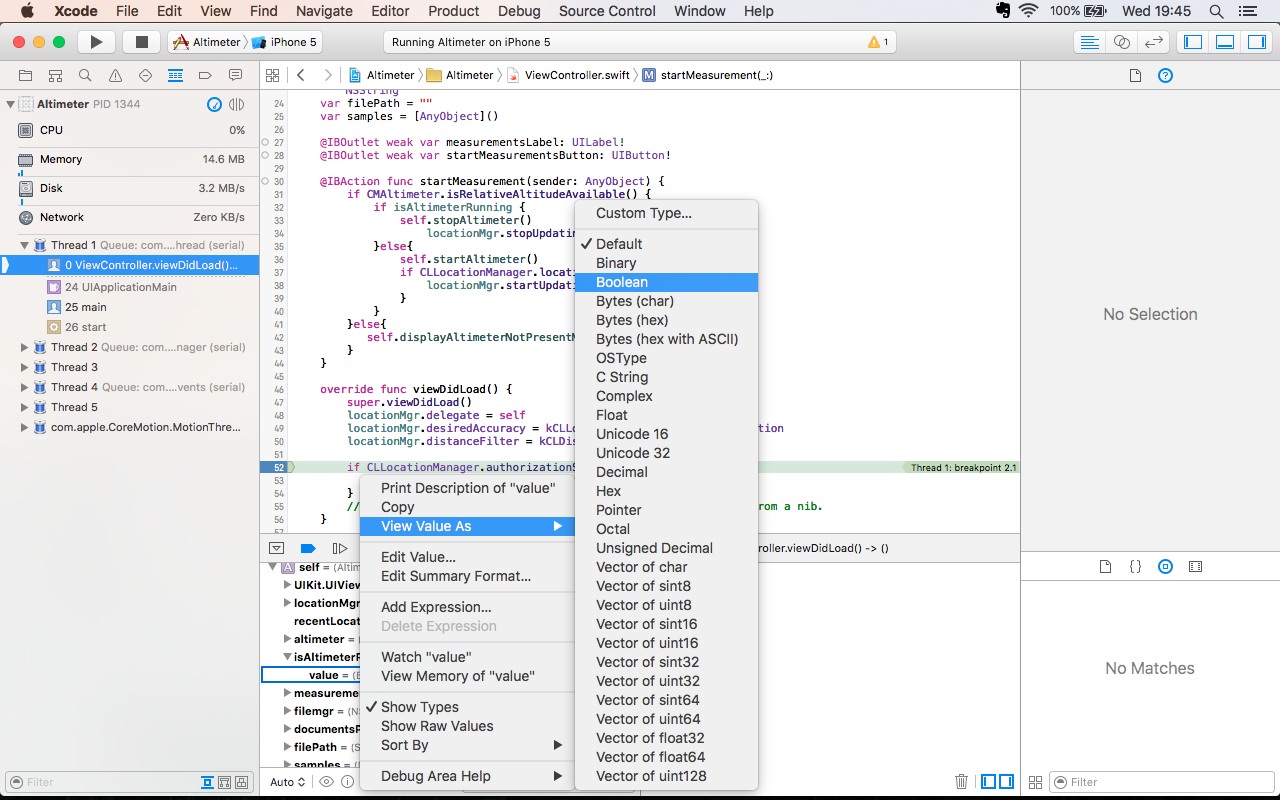
What if you would always like to see boolean values in a decimal format? Take a look at LLDB way to achieve this:
(lldb) print isAltimeterRunning.value
(Builtin.Int1) $R2 = false
(lldb) type format add --format decimal Builtin.Int1
(lldb) print isAltimeterRunning.value
(Builtin.Int1) $R3 = 0
An extra thing we can learn here is that Swift’s Bool is Builtin.Int1. I have to admit that Swift’s types do not work best with LLDB’s type formatting. A type name must be fully qualified. Older Cocoa objects and Obj-C/C are supported much better.
Type summary
In our post about print debugging we have learnt how to use CustomStringConvertible to get a meaningful debug description. A similar thing can be achieved in LLDB. To make it simple, we will use Int. What we usually see in Debug Area is this:
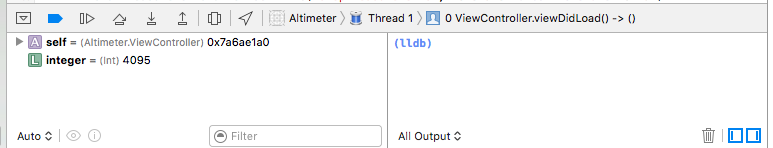
Let’s add a type summary and display it in a console:
(lldb) type summary add -s "natural=${var.value} octal=${var.value%o} hex=${var.value%x}" Int
(lldb) frame variable integer
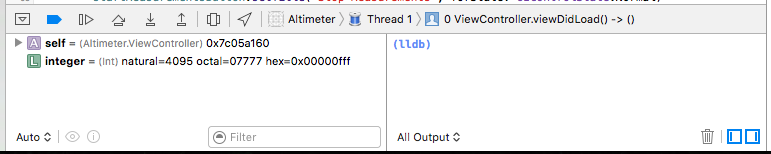
(Int) integer = 4095 natural=4095 octal=07777 hex=0x00000fff
When we check Debug Area again we will see our custom description:
Multiline expression mode
Note that we have a fully equipped compiler in our hands when debugging with LLDB. The best way to use its potential is to enter a multiline mode of an expression command. In LLDB type expression, then hit enter:
(lldb) expression
Enter expressions, then terminate with an empty line to evaluate:
1 struct compass{var direction = "N"; var angle = 16.5}
2 var c = compass()
3 print(c)
4
(compass #1)(direction: "N", angle: 16.5)
(lldb)
Thread backtrace
When debugging threads we often use Debug Navigator (⌘ + 5):
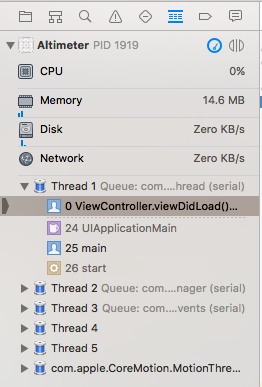
Similar, but even more verbose thread’s backtrace can be printed with this one-liner:
(lldb) thread backtrace all
Unwind on error
An extra thing to remember is that expressions executed in LLDB actually affect our executed code. If you change variable’s value in LLDB it will remain modified when continuing the execution.
What is more, some of those expressions may cause crashes. By default program state is cleaned up if the expression causes the crash. However, sometimes we want to see it.
Imagine decrementing var integer:UInt = 10 variable:
(lldb) expression while integer <= 0 {integer--}
error: Execution was interrupted, reason: EXC_BAD_INSTRUCTION (code=EXC_I386_INVOP, subcode=0x0).
The process has been returned to the state before expression evaluation.
We get an error printed but we can easily continue the execution.
To change that behaviour we will set an --unwind-on-error=0 parameter to our expression:
(lldb) expression --unwind-on-error=0 -- while integer <= 0 {integer--}
error: Execution was interrupted, reason: EXC_BAD_INSTRUCTION (code=EXC_I386_INVOP, subcode=0x0).
The process has been left at the point where it was interrupted, use "thread return -x" to return to the state before expression evaluation.
Now we get the actual crash.
Lookup of unformatted variable
In the type summary example above we have been doing our best to have a nicely formatted output and used a frame variable command to display it. Sometimes we want just the opposite - a raw value. Let’s see the difference:
(lldb) frame variable self.isAltimeterRunning
(Bool) self.isAltimeterRunning = false

(lldb) frame variable --raw self.isAltimeterRunning
(Swift.Bool) self.isAltimeterRunning = {
  value = 0
}
Now, that also explains how many Swift’s struct types are built. They contain a value variable. Digging deeper we can see an actual type that is wrapped in Bool type:
(lldb) frame variable self.isAltimeterRunning.value
(Builtin.Int1) self.isAltimeterRunning.value = 0
It is an Int1 type - a one-bit integer. If you would like to know more about unboxing Swift’s Bool and other types take a look at [SwiftUnboxed] blog. The --raw parameter is also very useful for looking inside Swift optionals and nested optionals.
That’s it!
Hopefully, you have noticed benefits of using LLDB console commands. Scope of this post is just a tip of the iceberg. You can read documentation of lldb on LLDB Documentation. Check out also their tutorial. Apple has a quick start on the developer portal. There are also many WWDC videos available:
- WWDC 2012: Debugging with LLDB
- WWDC 2014: Advanced Swift debugging in LLDB
- WWDC 2014: Introduction to LLDB and the Swift REPL
- WWDC 2015: What’s new in LLDB
Finally, a nice summary made by objc.io.
Update 21/01/2016
Do I have to type all that stuff over and over again?
If you are still not convinced about usefullness of command line LLDB, you may want to look at .lldbinit. It is a file that you place in your home directory. It contains a set of LLDB commands executed with each launch of LLDB. To create one for yourself execute the following in the Terminal:
michal$ cd ~/
michal$ touch .lldbinit
michal$ chmod +x .lldbinit
Then you can fill the .lldbinit file with a set of commands to be executed on every LLDB launch. For example:
breakpoint set -n malloc -N memory
breakpoint set -n free -N memory
breakpoint disable memory
Above commands set breakpoints at malloc and free functions and give them a common name ‘memory’. They are disabled, so that they do not disturb you, but are at hand if you will be debugging some memory related issues. To enable it just modify the last line in the file or type the following at the runtime:
(lldb) breakpoint enable memory
Take a look at the WWDC 2015: What’s new in LLDB video for more details.
More useful commands
In the WWDC talk mentioned above, you can find useful commands like:
- A
type lookupcommand:
(lldb) type lookup CLLocation
@available(iOS 2.0, *)
@objc class CLLocation : ObjectiveC.NSObject, NSCopying, NSSecureCoding {
  @objc deinit  {
  }
  @objc init(latitude: CoreLocation.CLLocationDegrees, longitude: CoreLocation.CLLocationDegrees)
  ...
- Setting an exception breakpoint for Objc/Swift language:
(lldb) breakpoint set -E objc
(lldb) breakpoint set -E swift
- Setting an exception breakpoint just for a specific type:
(lldb) breakpoint set -E -O EnumError
- Finally something for a really low level stuff lovers. A
memorycommand:
(lldb) po locationMgr
<CLLocationManager: 0x7af76280>

(lldb) memory read 0x7af76280
0x7af76280: 40 4a 17 00 60 63 f7 7a 00 00 00 00 00 00 00 00  @J..`c.z........
0x7af76290: 33 75 af 37 20 76 af 47 03 00 00 00 00 00 00 00  3u.7 v.G........
It’s true power is revealed when you lookup C arrays or char* strings.